
State of the Canadian tech job market: late 2026
On Nov 10, 2026, Lenny Rachitsky published "State of the tech job market: late 2026." It covers the US and is built on two private datasets, TrueUp and Live Data Technologies. We saw it and wanted to answer the same questions for Canadians, using open Canadian data instead of private datasets.
Two warnings. First, every number below is Canadian, except three foreign AI figures that are labelled as foreign. Second, Canada's open data cannot answer some of Lenny's questions at all. That gap is part of the story, and I flag it each time.
Welcome to my first job market report.
1. Tech vacancies fell from the 2022 peak, but some roles rose
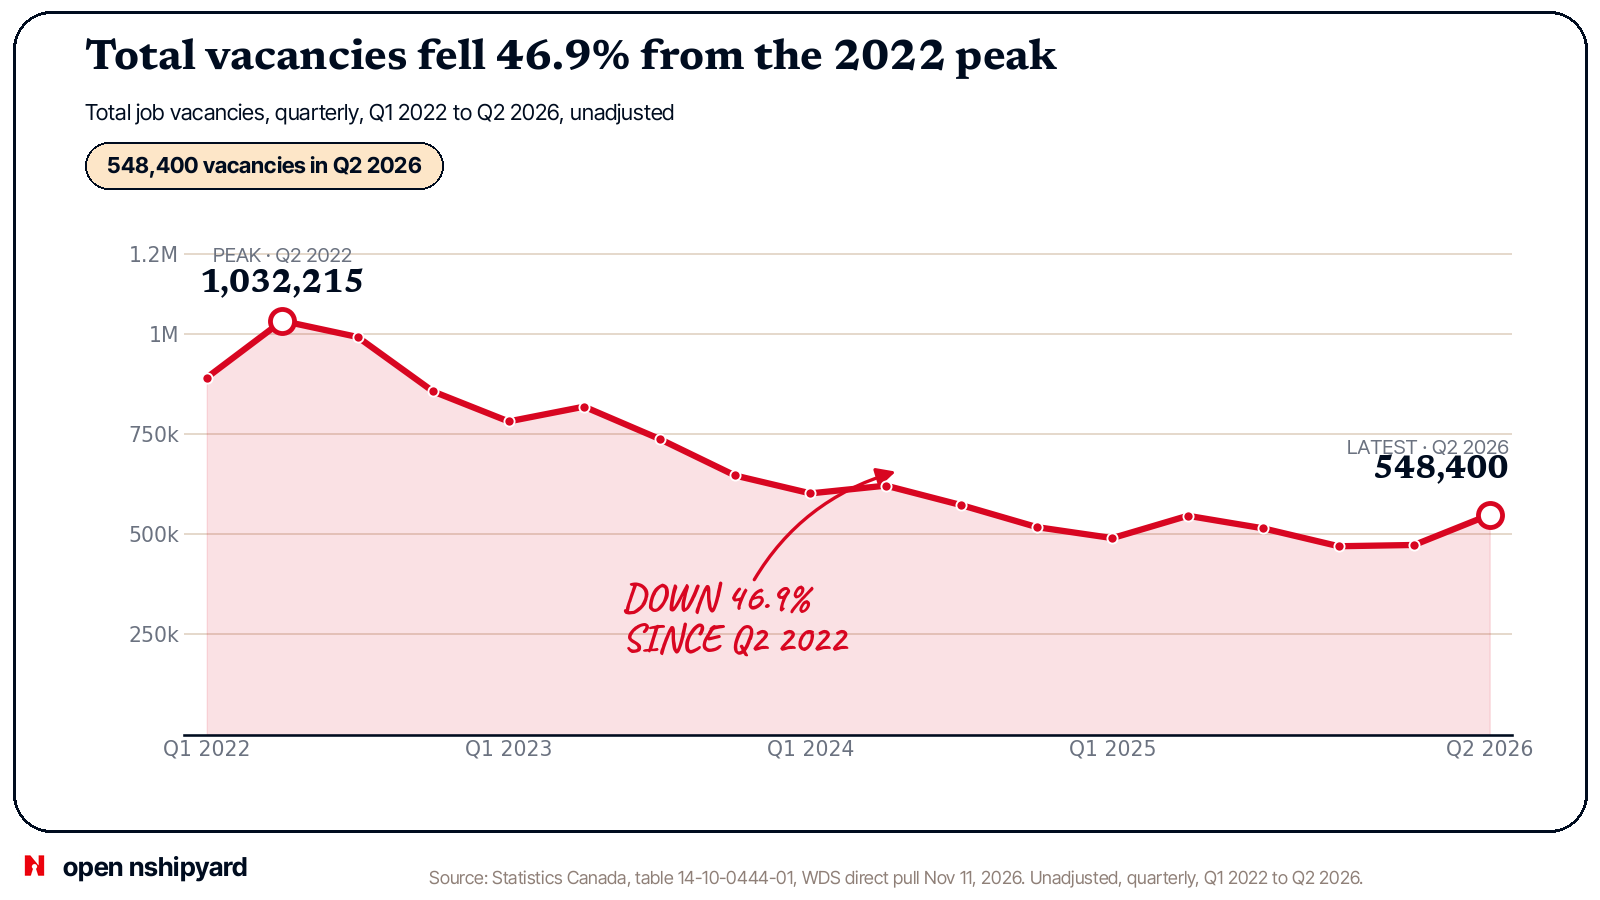
Start with the whole country. Canada had 1,032,215 job vacancies in Q2 2022, the peak. In Q2 2026 it had 548,400. That is down 46.9%. Both figures are unadjusted, from Statistics Canada table 14-10-0444-01. The seasonally adjusted total for Q2 2026 was 510,200, with a vacancy rate of 2.8%. I use unadjusted counts for every comparison in this report and never mix the two.
Tech fell harder. Add up the 11 tech occupations I track and open roles went from 40,290 to 15,425, down 61.7%. That sum is my arithmetic, not a StatCan series. The big codes did worse than that:
- Software engineers and designers (NOC 21231) went from 9,480 to 2,625, down 72.3%.
- Information systems specialists (NOC 21222) went from 9,805 to 2,910, down 70.3%.
- Computer systems developers and programmers (NOC 21230) went from 3,730 to 285, down 92.4%.
- Database analysts (NOC 21223) went from 2,055 to 660.
- Computer and information systems managers (NOC 20012) went from 3,340 to 2,170.
- Cybersecurity specialists (NOC 21220) went from 700 to 525. A gap of 175 roles on a base that small is basically flat.
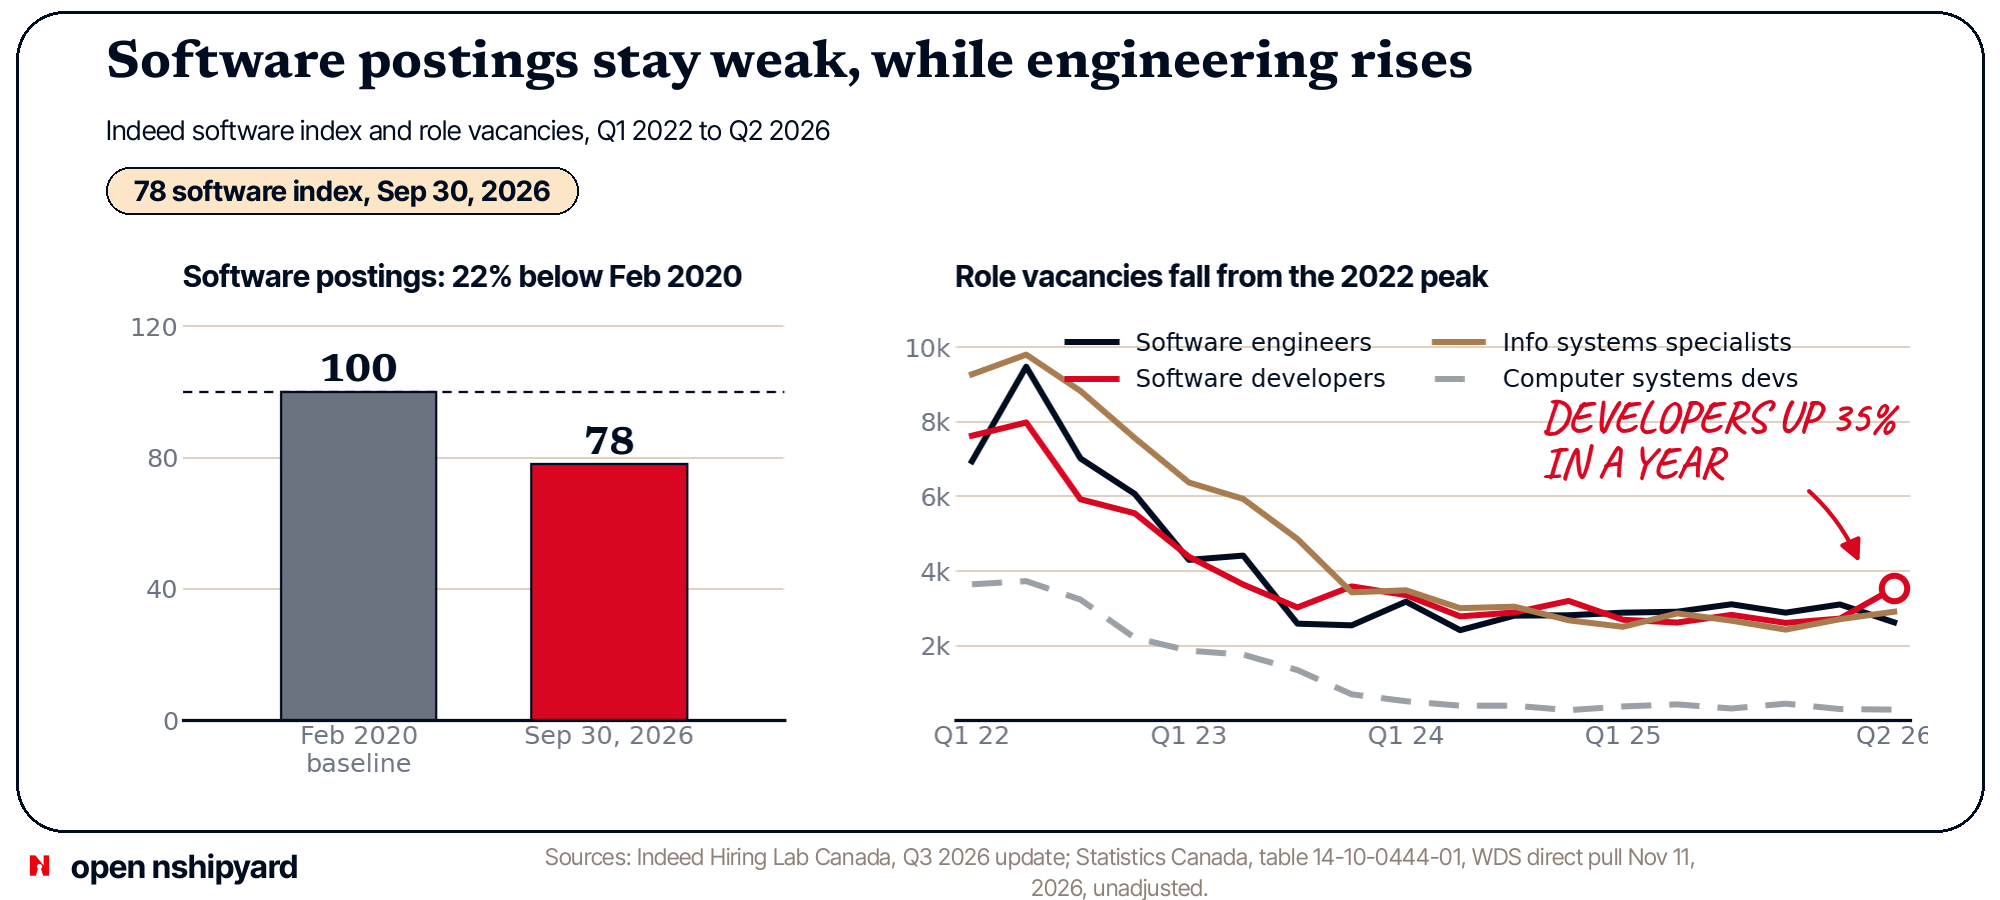
Two roles rose in the past year. Software developers and programmers (NOC 21232) are still down 55.6% from the peak, at 3,545 against 7,985. But they sat at 2,620 in Q2 2025, so they added 925 open roles in 12 months, up 35.3%. User support technicians (NOC 22221) went from 3,200 at the peak to 2,365, and they are up 480 in a year, or 25.5%.
One role appears to have exploded, and I do not trust it. Data scientists (NOC 21211) went from 100 open roles in Q2 2022 to 1,435 in Q2 2026. But the series jumps from 25 in Q3 2023 to 770 in Q4 2023. Nothing grows 30 times in one quarter. That looks like a classification or sample break, so do not read it as organic growth.
2. Software postings stay weak, while engineering postings rise
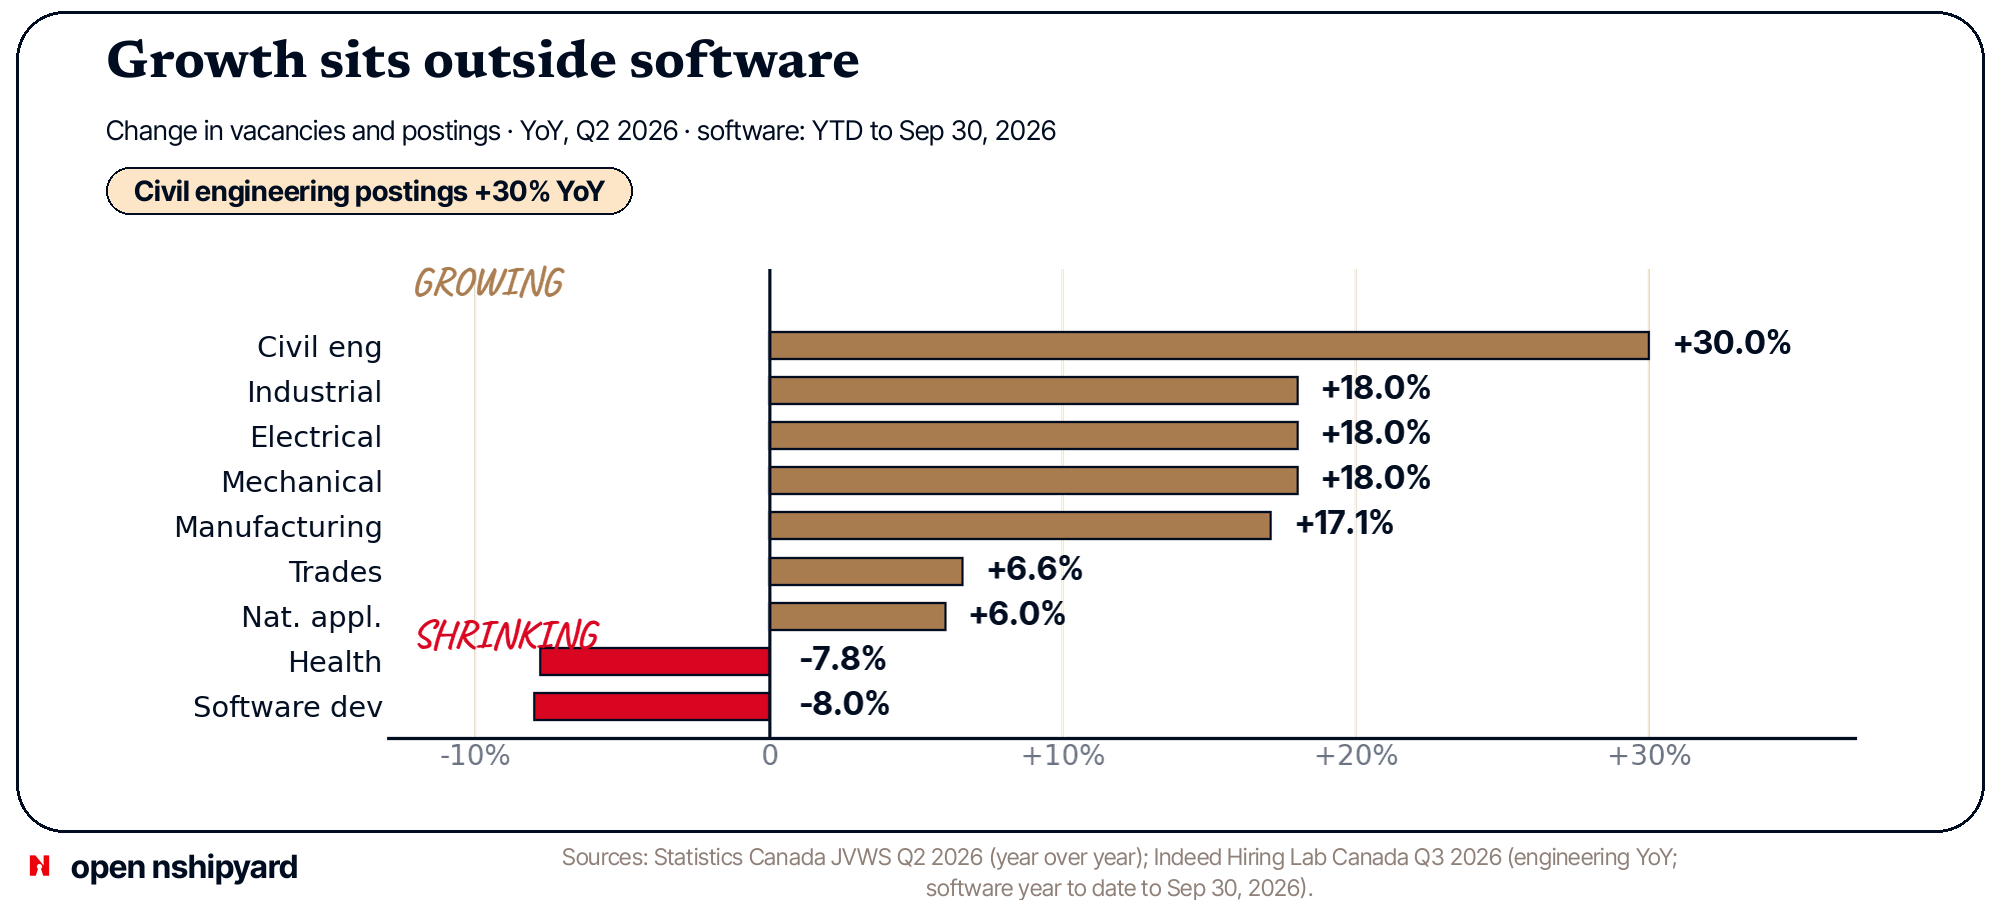
Indeed Hiring Lab Canada published its Q3 2026 update on Oct 27, 2026. Software postings were down 8.0% year to date as of Sep 30, 2026. The index sits at 78, where Feb 2020 equals 100. So Canadian software postings are 22% below where they were before the pandemic, not just below the 2022 high.
Engineering postings on the same site went the other way. Civil engineering postings are up 30% year over year. Industrial, electrical, and mechanical engineering postings are each up 18%.
Indeed and StatCan do not line up neatly. StatCan shows developer and programmer vacancies up 35.3% in the year to Q2 2026. Indeed shows software postings down 8.0% in the first nine months of 2026. One is an employer survey by occupation code, the other is online postings on one site, and the periods differ. I cannot reconcile them with open data, so I report both.
The price point for the software work that remains: the average offered hourly wage for software engineers and designers was $55.85 in Q2 2026, across those 2,625 open roles.
Lenny's fastest-growing engineering role is the forward deployed engineer, up 4.6x in a year in his data. Canada has no count for it. Indeed Hiring Lab does not break it out in its Canada update, and StatCan has no occupation code for it. The jobs exist here. Extreme Networks posted a senior forward deployed engineer role in Toronto in October 2026, and Anvil posted one in Ottawa in August. But with no series counting them, there is no Canadian version of Lenny's 4.6x.
3. Graphic designers fell 74%. Product designers are not counted in Canada
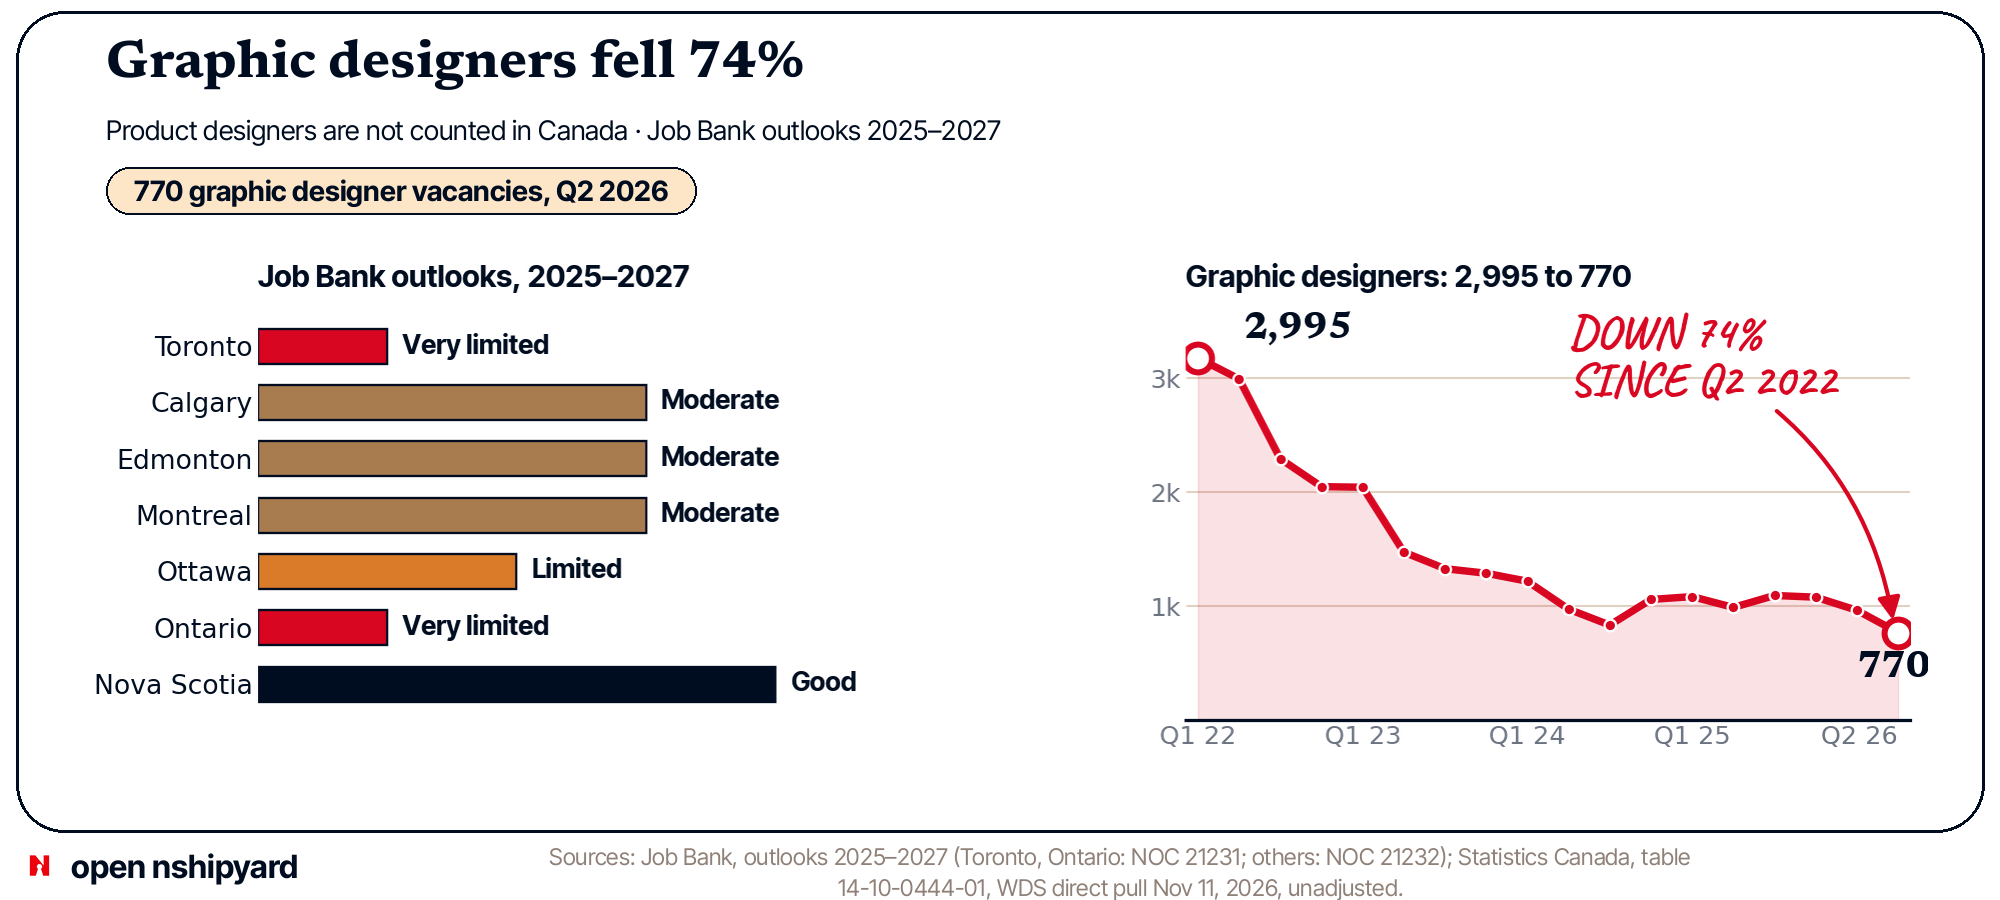
Lenny's report tracks product designers. Canada cannot. The closest real design count in open data is graphic designers and illustrators (NOC 52120). They went from 2,995 open roles in Q2 2022 to 770 in Q2 2026, down 74.3%. That is a steeper fall than software engineers and designers at 72.3%, and far steeper than the national total at 46.9%.
Web designers (NOC 21233) went from 335 to 75. Treat that with care, because 7 of the 18 quarters in the series are suppressed in the source. When a count is that small, StatCan withholds it. Web developers and programmers (NOC 21234) have a full series and went from 1,125 to 380.
The gaps are large. Canada has no product design count in open data, no product manager count, and no forward deployed engineer count. The "designers" in NOC 21231 are people who design software systems, so that code does not count product designers. I checked StatCan's vacancy table and FRED for a product manager series. The table has no product manager code, and FRED carries Indeed's Canada postings only as a national index and broad sectors. Nothing open counts any of the three.
4. Everybody now needs AI, but Ontario's rule pushed Canada's number up
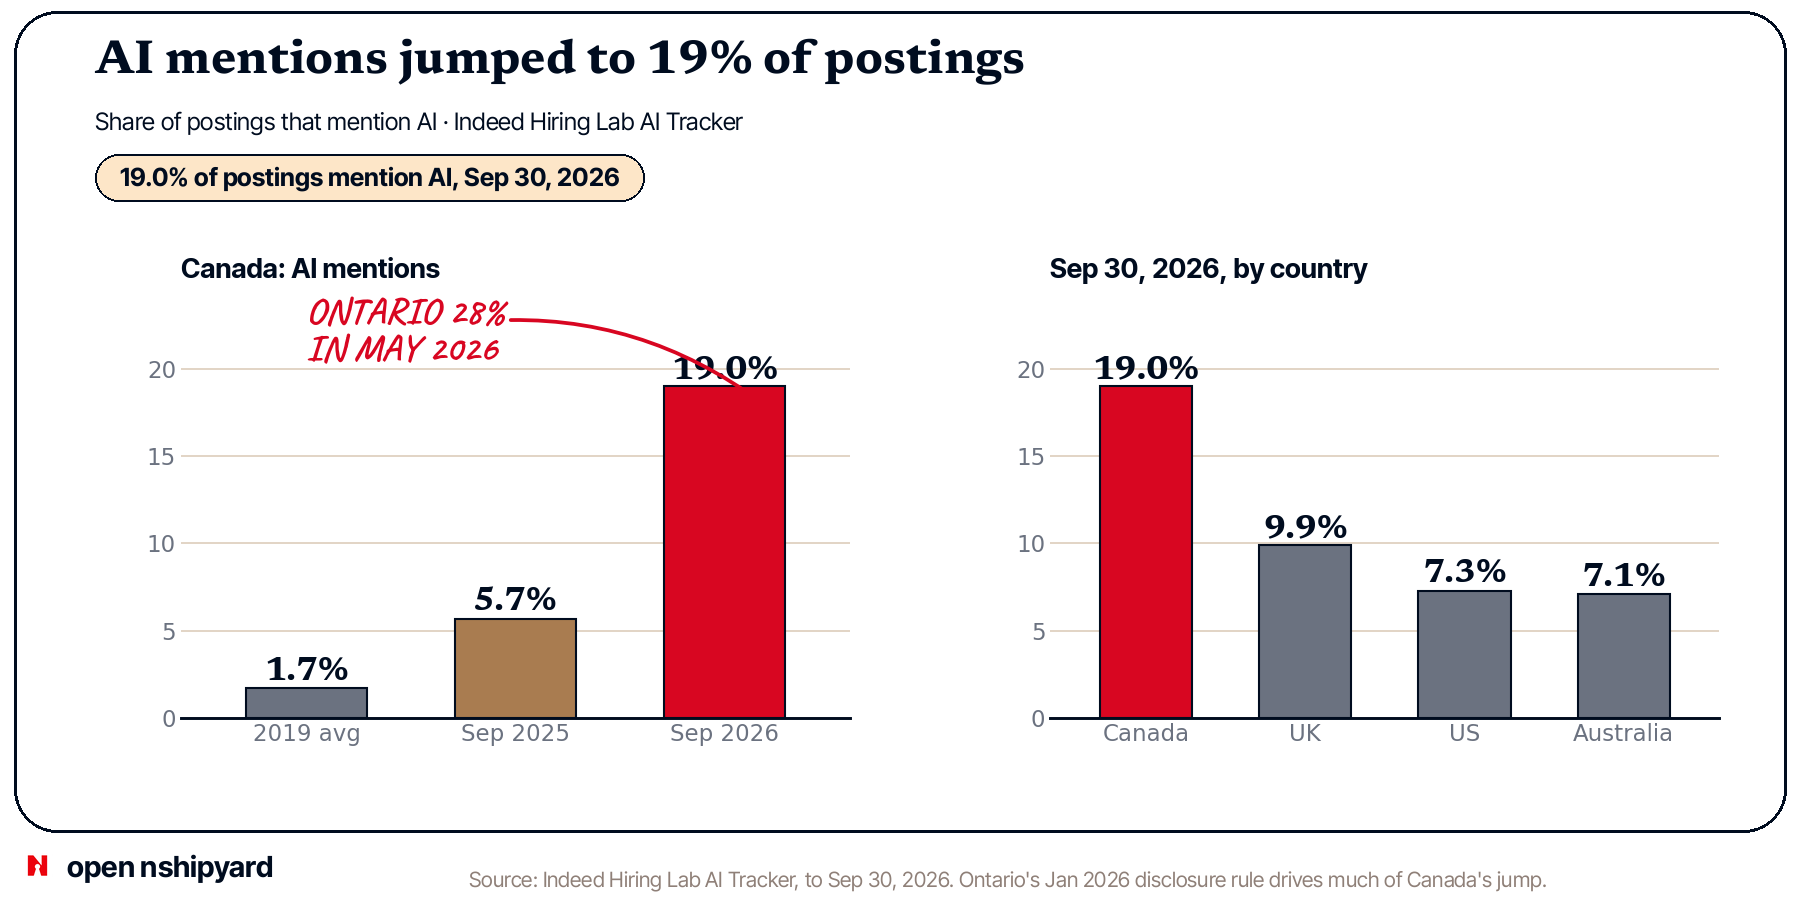
On Sep 30, 2026, 19.0% of Canadian job postings on Indeed mentioned AI. A year earlier it was 5.7%. In 2019 it was 1.7%. The share more than tripled in 12 months.
Canada is now far ahead of its peers on this measure. The US was at 7.3%, the UK at 9.9%, and Australia at 7.1%. A country with software postings at index 78 did not become 2.6 times more AI-hungry than the US in one year, so something else is in the number.
That something is Ontario. In Jan 2026, Ontario began requiring employers with 25 or more staff to disclose AI use in hiring. A posting that says "we use AI to screen applicants" counts as an AI mention. Ontario's share of postings mentioning AI hit 28% in May 2026.
So part of the jump comes from a government rule, not from employers asking for AI skills. I do not have a number that splits the two. Until someone separates disclosure lines from skill requirements, 19.0% overstates how many Canadian jobs actually need AI skills.
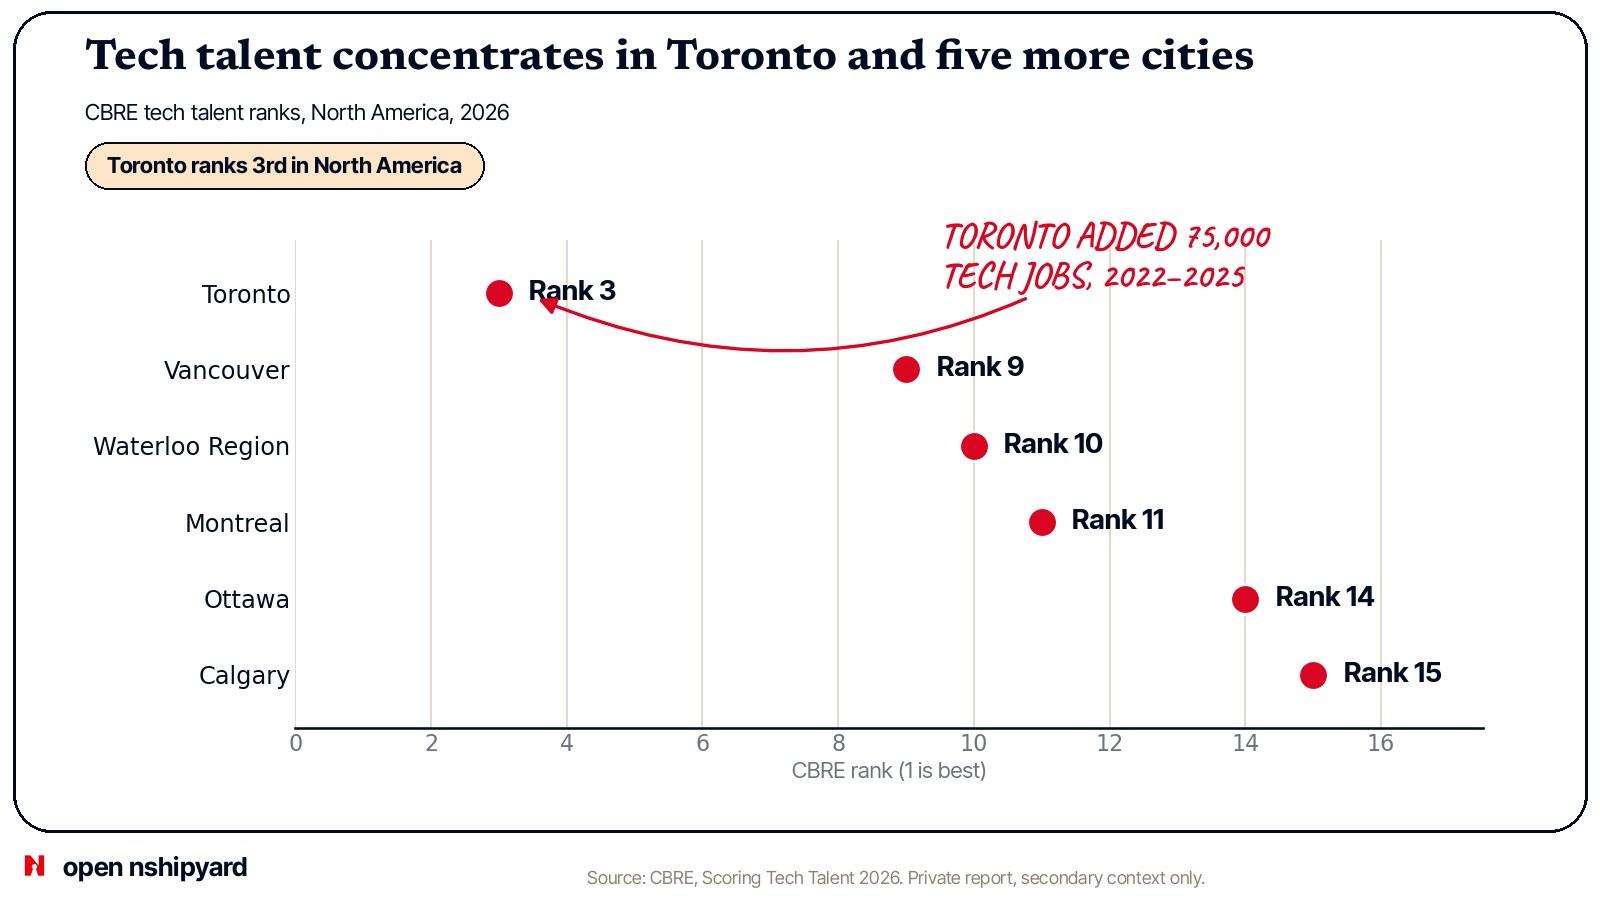
5. Tech talent concentrates in Toronto and in five more cities
This section relies on CBRE's Scoring Tech Talent 2026. It is a private report, so treat it as secondary context. Toronto ranks 3rd in North America. Vancouver ranks 9th, Waterloo Region 10th, Montreal 11th, Ottawa 14th, and Calgary 15th. That is six Canadian markets in the top 15.
CBRE says Toronto added 75,000 tech jobs from 2022 to 2025. It says Canada's tech talent grew by 91,300 in 2025, or 7.6%, to nearly 1.3 million. Toronto, Montreal, and Vancouver hold 60% of Canada's AI jobs.
Set that against the federal view. Job Bank's 2025 to 2027 outlooks rate prospects as Very limited in Toronto and Ontario, Limited in Ottawa, Moderate in Calgary, Edmonton, and Montreal, and Good in Nova Scotia. The city with the most tech workers has the worst outlook rating.
Both can be true. CBRE counts people already employed in tech. StatCan and Job Bank look at openings. Toronto has 75,000 more filled tech jobs than in 2022, and Canada has 6,855 fewer open software engineer and designer roles than in Q2 2022. The seats exist, but they are occupied.
6. Remote stays low in Q2 2026 postings, and hybrid is the realistic option
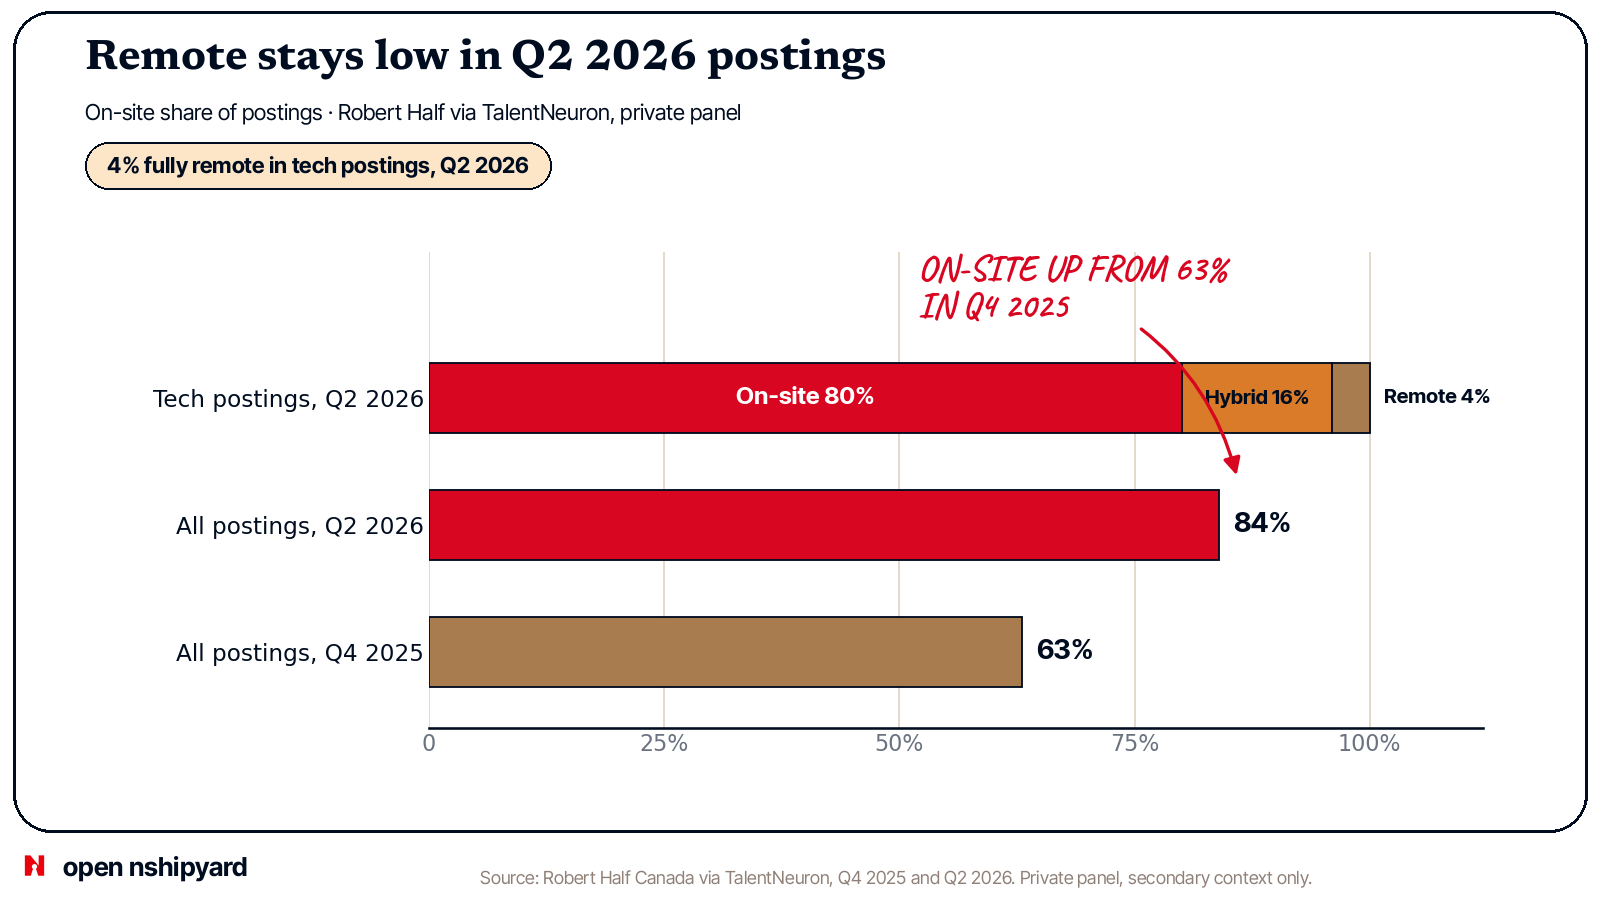
The data here comes from Robert Half Canada via TalentNeuron. It is a private panel, so again, secondary context. In Q2 2026, tech postings were 80% on-site, 16% hybrid, and 4% fully remote.
Hybrid is the realistic ask. At 16%, it is four times the fully remote share. If you want flexibility in a Canadian tech job, 1 in 6 postings offers some and 1 in 25 offers all of it.
Tech is only slightly more flexible than everything else. Across all postings in Q2 2026, 84% were on-site, which is 4 points above tech. That 84% is up from 63% in Q4 2025, a 21-point move in two quarters. A move that size on a private panel deserves caution, and I cannot verify it against open data.
Open data has nothing to offer here. The StatCan vacancy table I used has no work-location field. Postings also describe what employers advertise, not how people end up working.
7. Growth sits outside software, in engineering, trades, and manufacturing
Back to StatCan, Q2 2026, unadjusted, same table. Trades, transport and equipment operators had 105,255 vacancies, up 6.6% in a year. Manufacturing and utilities had 21,215, up 17.1%. Natural and applied sciences, the group that holds both software roles and engineers, had 43,400, up 6.0%.
Those gains came while the big software codes sat 55.6% to 72.3% below peak. Indeed shows where the natural and applied sciences demand is: civil engineering postings up 30%, and industrial, electrical, and mechanical each up 18%. Meanwhile there are about 40 open trades and transport roles for every open software engineer and designer role, 105,255 against 2,625.
Not everything outside software is growing. Health had 63,850 vacancies, down 7.8% in a year.
The Labour Force Survey explains why this feels worse than it looks on paper. National unemployment was 6.7% in October 2026 and youth unemployment was 13.7%. Unemployment in natural and applied sciences was 2.8% in September 2026. People already in the field are mostly working. The squeeze falls on people trying to get in, and 2,625 open software engineer and designer roles do not go far among new graduates.
Conclusion
Product managers are winning in the US. In Canada, we cannot count them. I checked StatCan's vacancy table and FRED. StatCan's table has no product manager code, and FRED carries Indeed's Canada postings only as a national index and broad sectors. No one publishes a Canadian equivalent of TrueUp. The nearest proxy is computer and information systems managers, at 2,170 open roles against 3,340 at the peak. That is a different job, and there is no Canadian count for product managers.
Engineers are splitting, not collapsing. Software engineers and designers are down 72.3% from the peak, at 2,625 open roles. Computer systems developers and programmers are down 92.4%, at 285. But software developers and programmers added 925 open roles in a year, up 35.3%, and user support technicians added 480, up 25.5%. Indeed's software index is at 78 and still falling, down 8.0% year to date. The floor may be in for some codes and not others.
Designers are hurting. Graphic designers and illustrators fell from 2,995 open roles to 770, down 74.3%. That is the worst result among the roles with a clean series, apart from computer systems developers and programmers. Web designers fell from 335 to 75, with 7 of 18 quarters suppressed. Product design has no count at all.
The biggest hiring boom is not in software. It is in engineering, trades, and manufacturing. Civil engineering postings are up 30%. Manufacturing and utilities vacancies are up 17.1%. Trades and transport sit at 105,255 vacancies, up 6.6%. AI mentions in postings did jump, from 5.7% to 19.0% in a year, but partly because Ontario made employers with 25 or more staff disclose AI use in hiring. Ontario hit 28% in May 2026. The US sits at 7.3% without that rule.
If you work in Canadian tech and have a job, the 2.8% unemployment rate in natural and applied sciences says you are in the majority. If you are looking for one, there are 548,400 vacancies in the country and 2,625 of them are for software engineers and designers, at $55.85 an hour.
Method note
All vacancy counts come from Statistics Canada table 14-10-0444-01, the Job Vacancy and Wage Survey, quarterly, unadjusted. I pulled them direct from StatCan's Web Data Service API by vector ID, because StatCan's website blocks automated reads. The one seasonally adjusted figure (510,200 vacancies, 2.8% rate) is labelled as such and never blended with unadjusted counts. Sums and differences across occupation codes are my own arithmetic.
Posting trends and AI mention shares come from Indeed Hiring Lab Canada's Q3 2026 update, published Oct 27, 2026. Unemployment figures come from the Labour Force Survey. Outlook ratings come from Job Bank, 2025 to 2027.
CBRE Scoring Tech Talent 2026 and Robert Half Canada via TalentNeuron are private sources. I label them as secondary context wherever they appear.
Canada has no equivalent of TrueUp or Live Data Technologies. I checked StatCan's vacancy table and FRED's Indeed series before writing that. The table has no product manager code, and FRED's Indeed series for Canada cover the national index and broad sectors only. So there is no Canadian hiring series by tech role, and no counts for product managers, product designers, or forward deployed engineers.
Sources
- Statistics Canada, table 14-10-0444-01, Job Vacancy and Wage Survey, read direct through the StatCan Web Data Service. Pull Nov 11, 2026. statcan.gc.ca
- Statistics Canada, The Daily, Job vacancies, second quarter 2026. Sep 15, 2026. statcan.gc.ca
- Statistics Canada, The Daily, Labour Force Survey, October 2026. Nov 6, 2026. statcan.gc.ca
- Indeed Hiring Lab Canada, Q3 2026 Canadian Labour Market Update. Oct 27, 2026. hiringlab.indeed.com
- Indeed Hiring Lab Canada, Ontario Job Postings Highlight the Widespread Use of AI in Hiring Processes. Jul 8, 2026. hiringlab.indeed.com
- Employment and Social Development Canada, Job Bank, wages and outlooks, NOC 21231 and 21232. Outlook 2025-2027. jobbank.gc.ca
- Robert Half Canada, Canadian Remote Work Statistics and Trends for 2026, via TalentNeuron. Private, secondary context only. Jul 21, 2026, updated Sep 8, 2026. roberthalf.com
- CBRE, Scoring Tech Talent 2026. Private report, secondary context only. Aug 2026. cbre.com
- Lenny Rachitsky, State of the tech job market: late 2026. Model only, not a data source. Nov 10, 2026. lennysnewsletter.com